🌊 Coastal Hypoxia Monitoring
Research in Jakarta Bay
This website displays IoT Buoy data equipped with Dissolved Oxygen (DO) and Temperature sensors to study water quality and hypoxia dynamics.
📊 View DashboardResearch in Jakarta Bay
This website displays IoT Buoy data equipped with Dissolved Oxygen (DO) and Temperature sensors to study water quality and hypoxia dynamics.
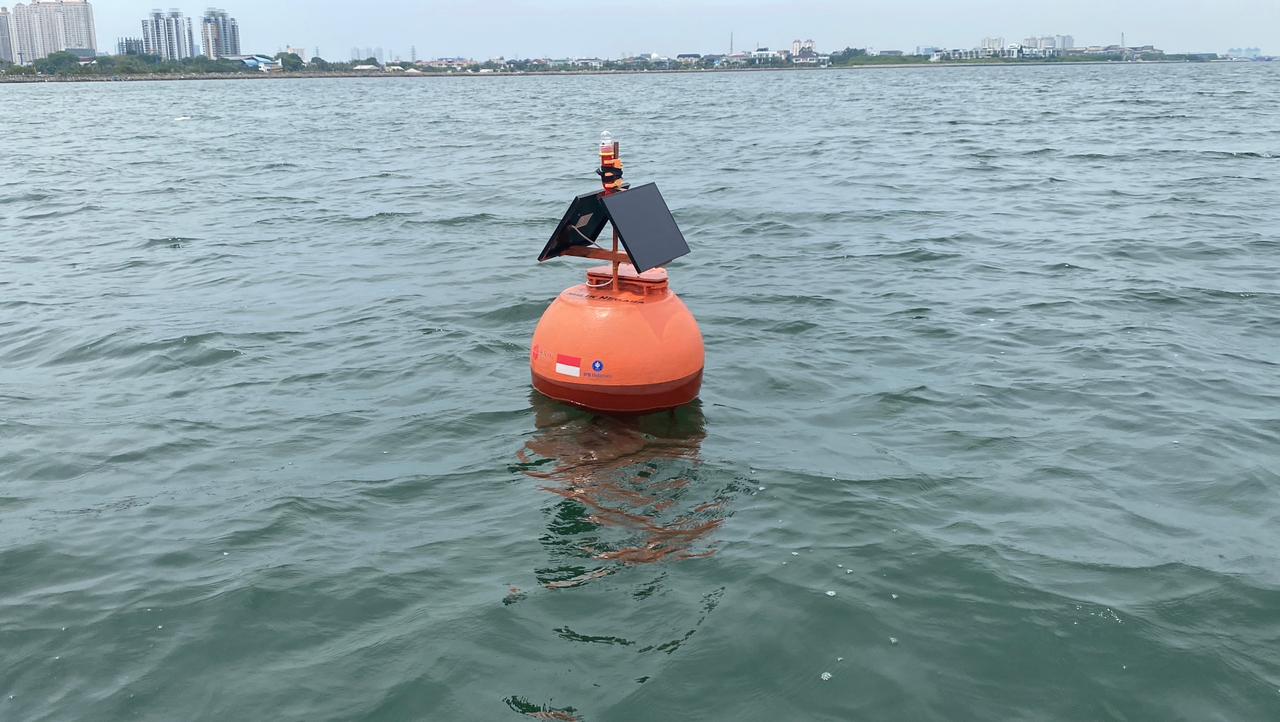
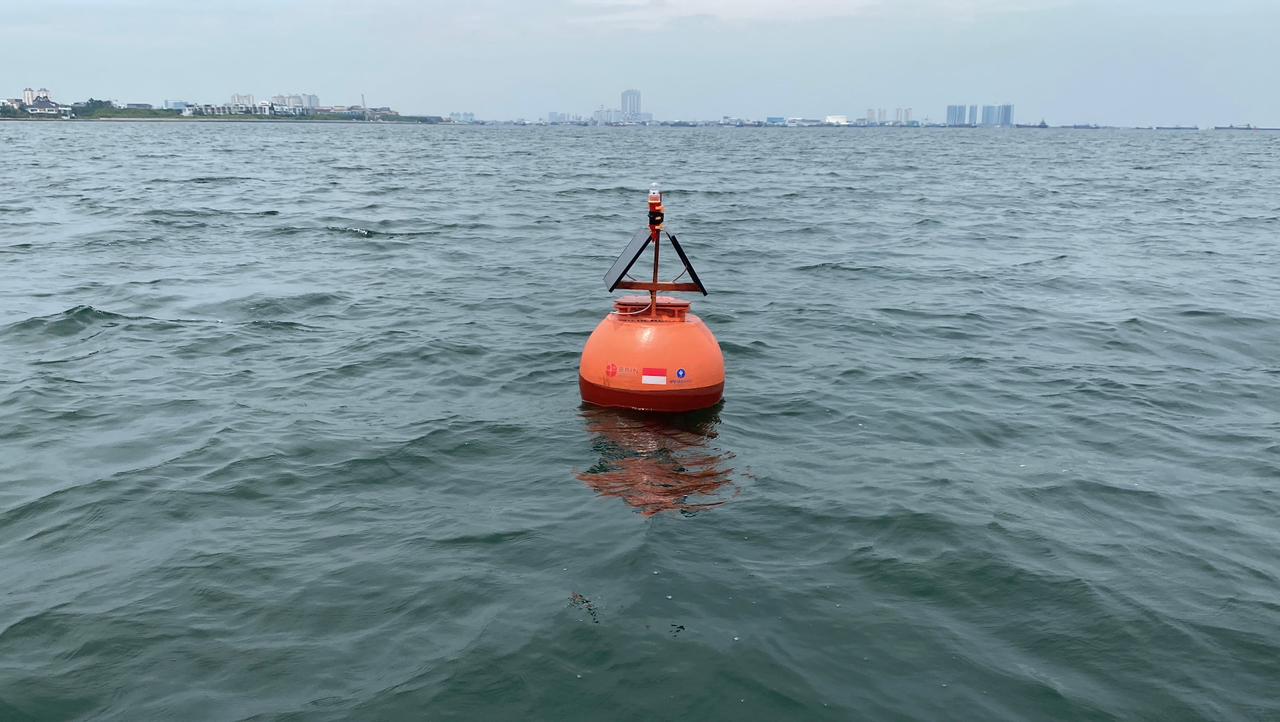
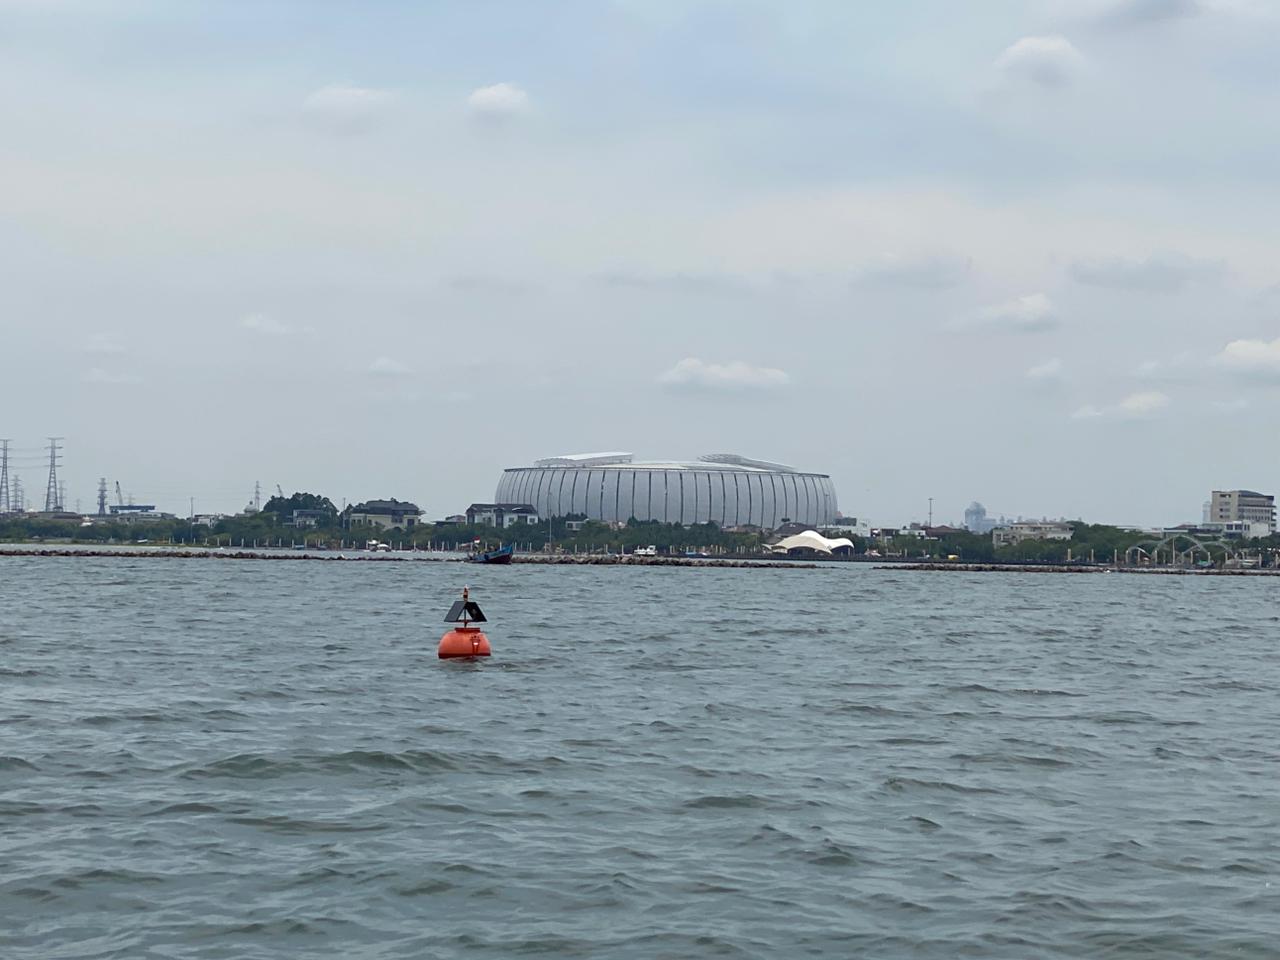
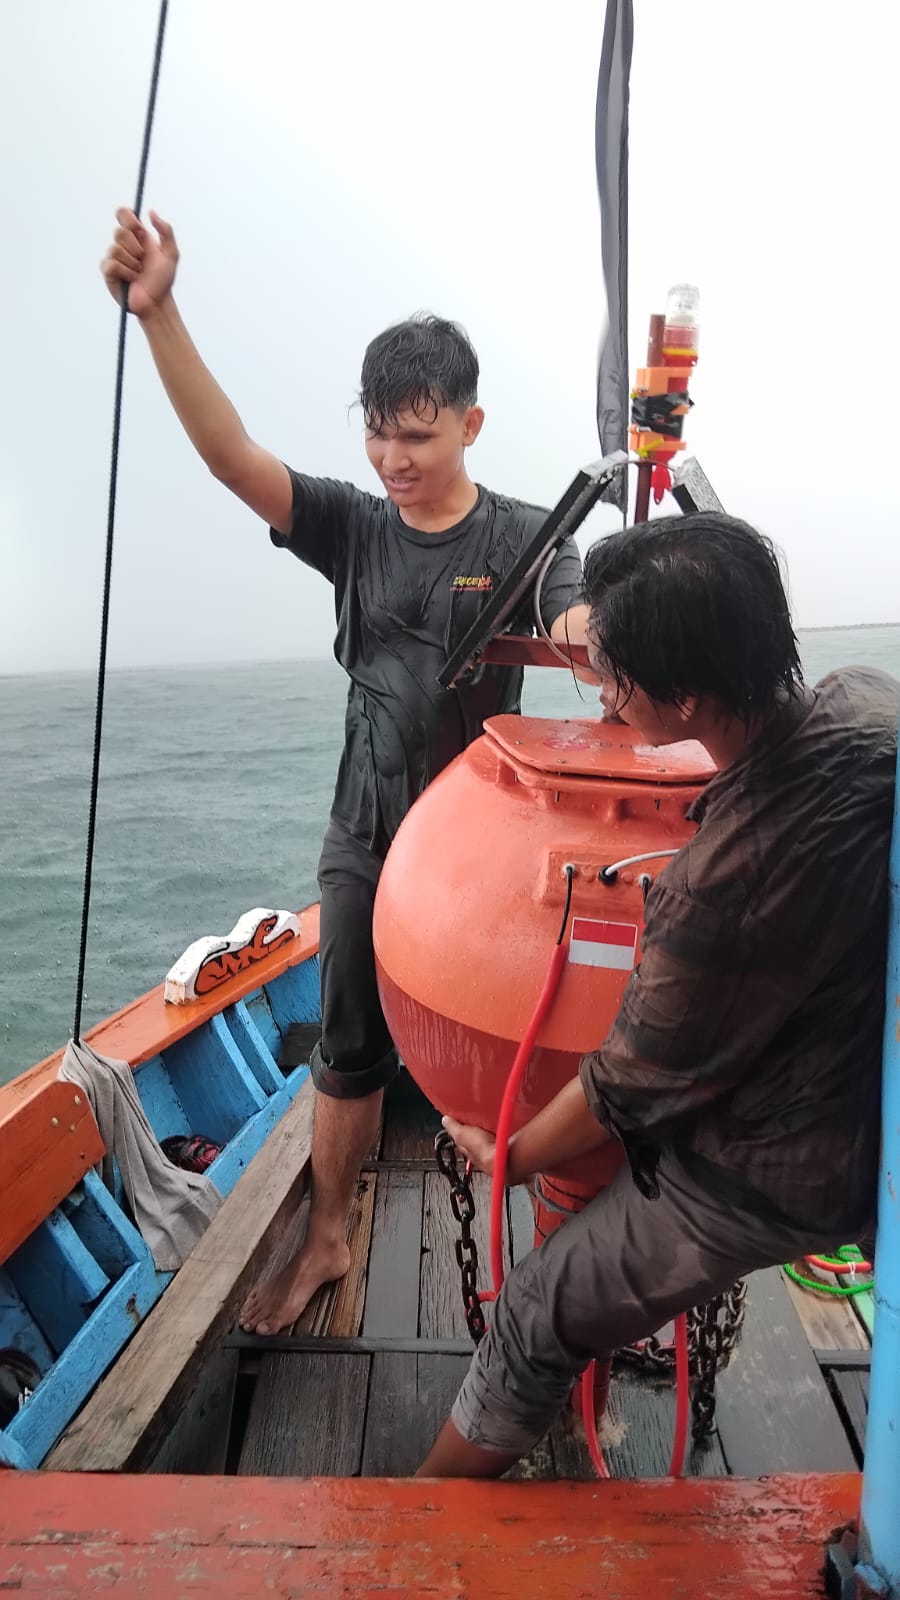
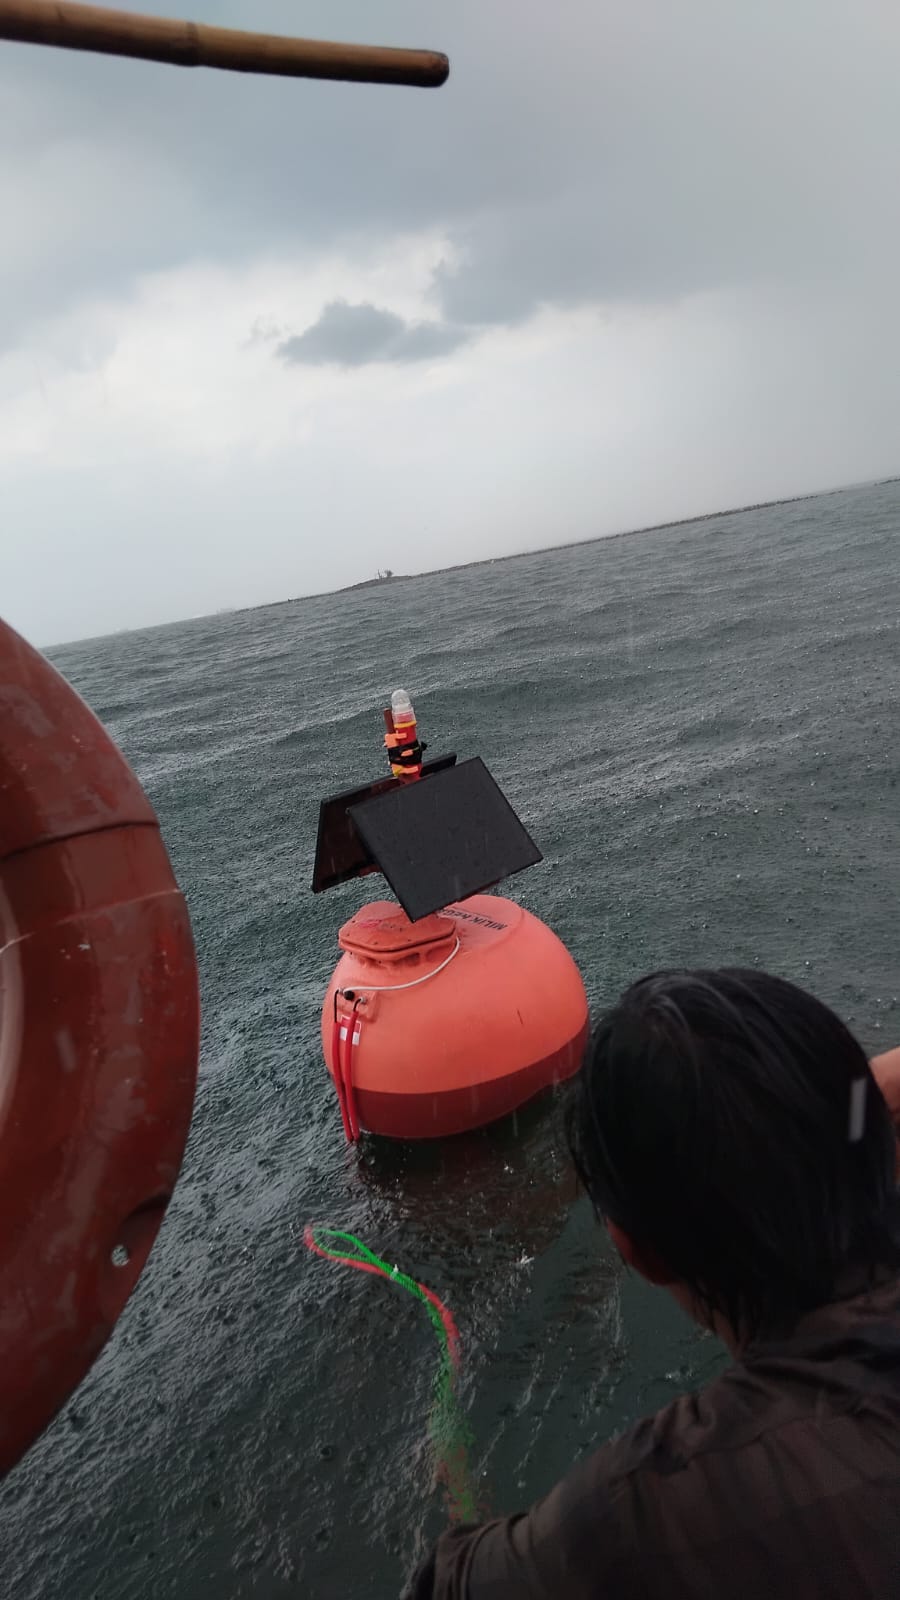
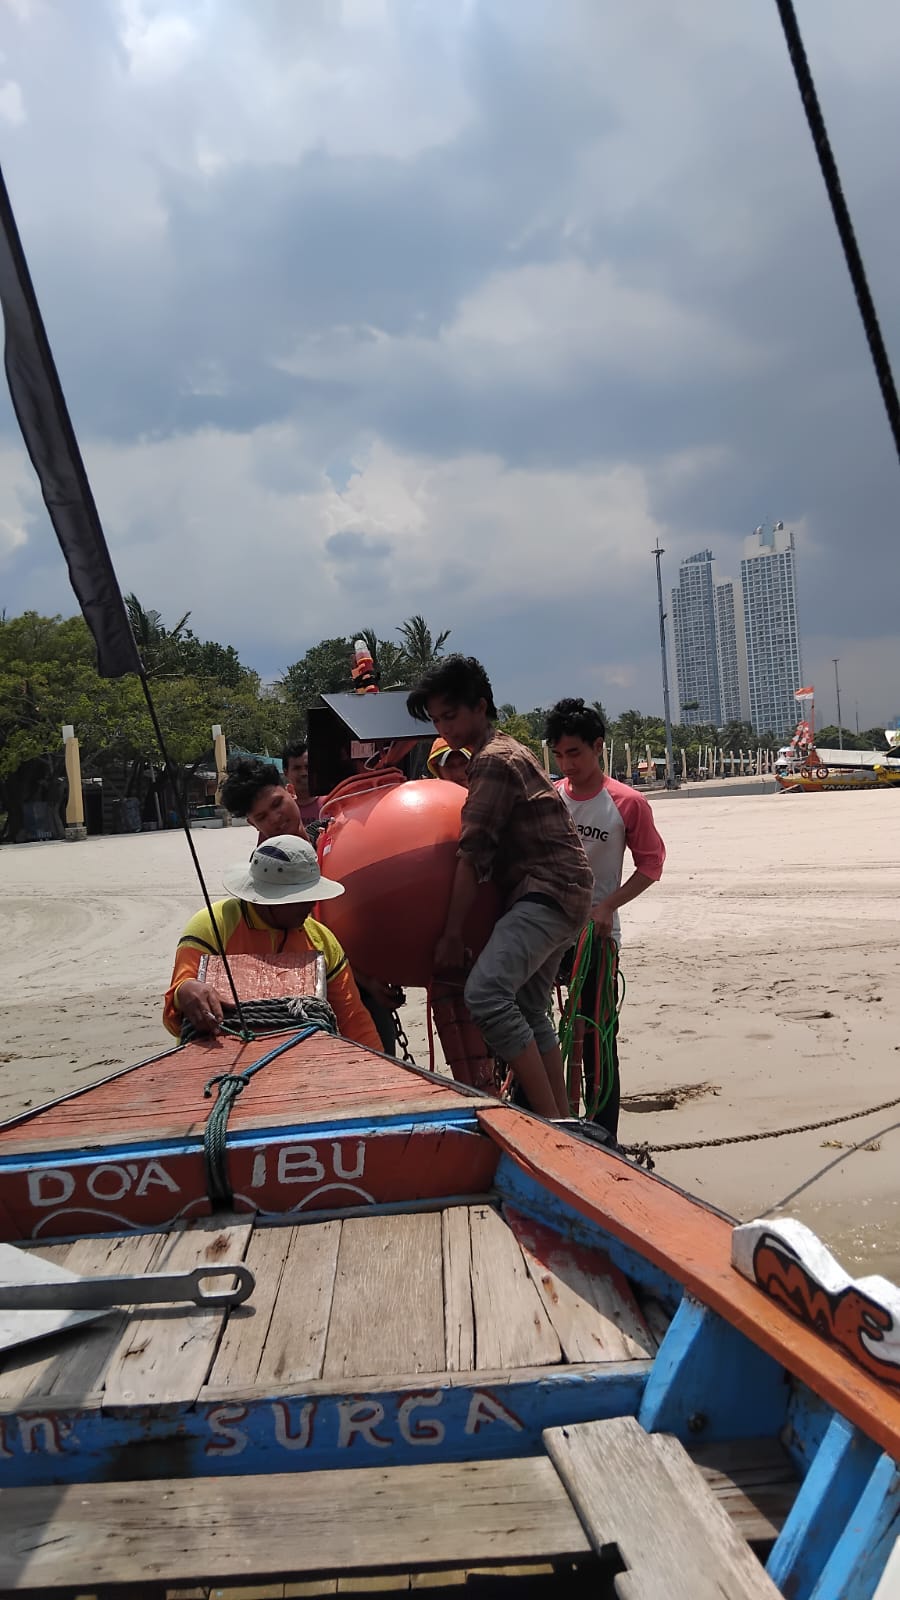
📊 View DashboardThe Ocean Hypoxia Monitoring Project aims to study oxygen depletion in Jakarta Bay using real-time IoT buoys developed by BRIN and IPB University. This system measures dissolved oxygen at surface and bottom layers to identify hypoxic zones that can impact marine life and coastal ecosystems.
Although the current observation is based on a single buoy, the planned 2026 deployment will expand the monitoring network to multiple sites distributed across Jakarta Bay, representing nearshore-to-offshore environmental gradients.
Measurement of dissolved oxygen and temperature at depth in Jakarta Bay to detect potential hypoxia zones.
Monitoring oxygen and temperature near the surface to capture vertical stratification and water exchange dynamics.
An index from 0–100 used to represent the daily hypoxia risk in a simple and intuitive way.
| Date (UTC+7) | DO Bottom (mg/L) | ΔDO (Bottom-Surface) | ΔTemp (Bottom-Surface) | HRI Score | Kategori |
|---|
| Date | Surface DO (mg/L) | Bottom DO (mg/L) | Surface Temp (°C) | Bottom Temp (°C) | ||||||||||||||||
|---|---|---|---|---|---|---|---|---|---|---|---|---|---|---|---|---|---|---|---|---|
| Date (UTC+7) | Min Time | Max Time | Min | Max | Mean | STD | Min Time | Max Time | Min | Max | Mean | STD | Min | Max | Mean | STD | Min | Max | Mean | STD |
*) The dataset displayed on this page originates from the IoT Hypoxia Buoy developed and operated by the National Research and Innovation Agency (BRIN) and IPB University. Any external use, redistribution, or publication of this dataset must be carried out with prior authorization and communication with the responsible researchers.
.jpeg)
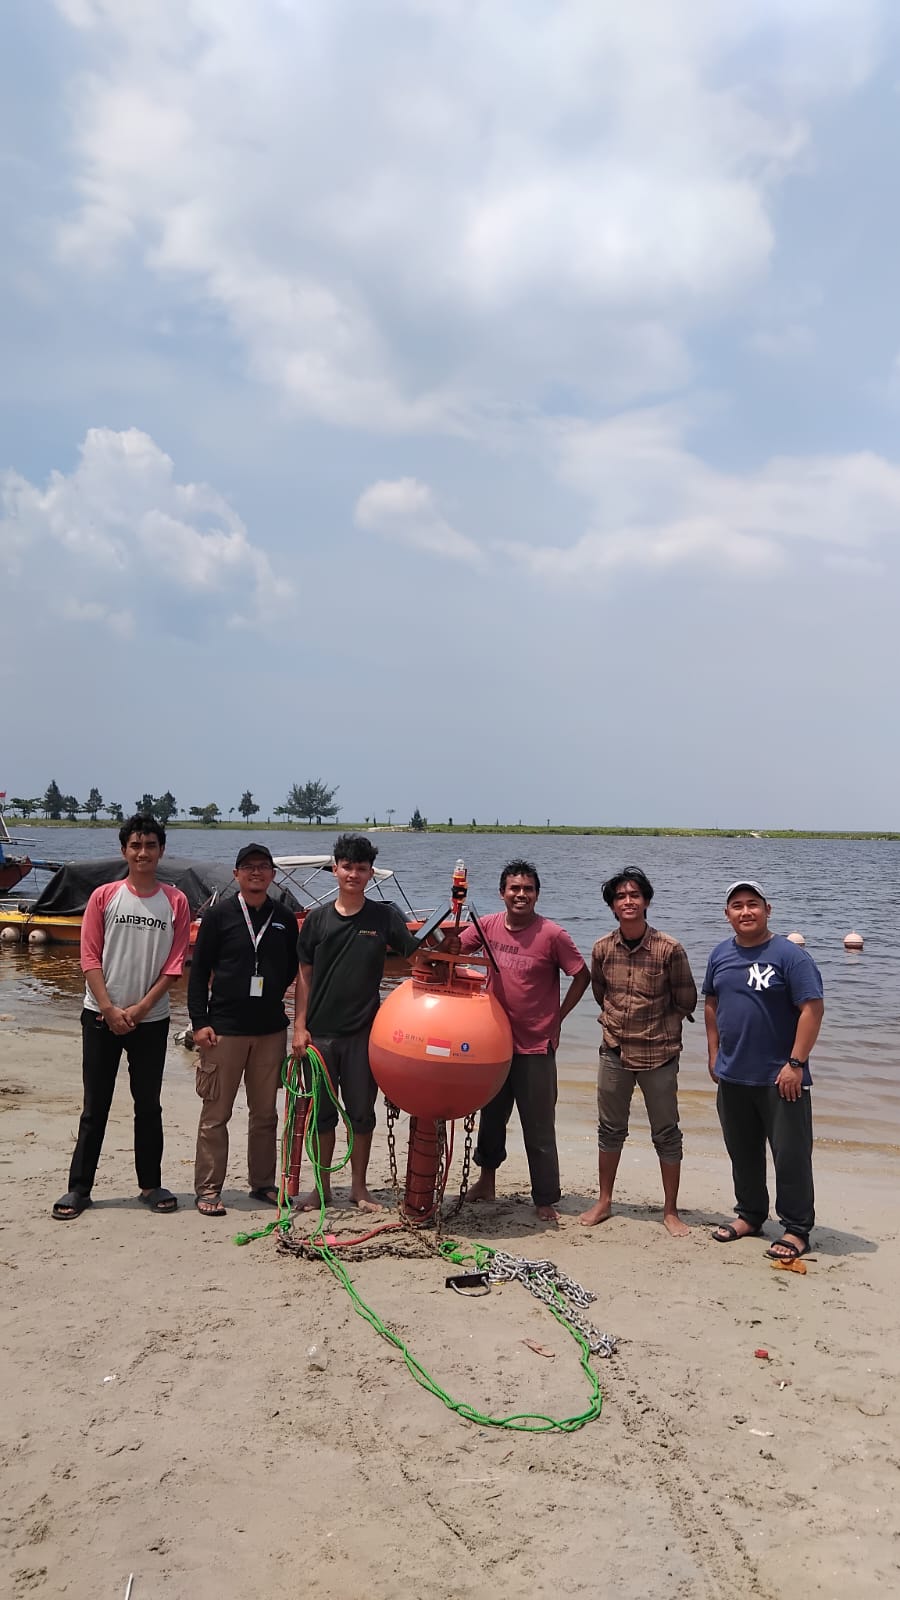
Lead Institutions: BRIN – National Research and Innovation Agency, and IPB University.
Collaborators include marine scientists, engineers, and data analysts focusing on smart monitoring of coastal ecosystems.